
Widespread migration online, combined with limited mobility and a geographically dynamic virus, are heightening fraud detection challenges.
Given the increasingly widespread implementation of social distancing and work-from-home policies, it is expected that behavior patterns across the globe will be changing radically as increasing numbers of people migrate their actions online in order to manage both their work and personal lives.
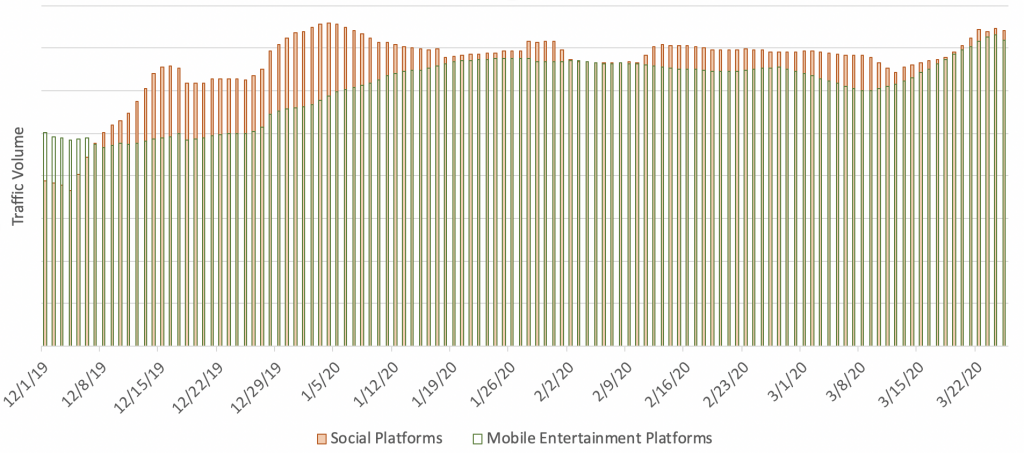
Social Platforms and Mobile Entertainment Trends
These changing patterns are already being reflected in the data we analyze as we work to protect our clients from new and emerging fraud threats. Among the many trends we?re observing are significant increases in traffic volume on social platforms and on mobile entertainment platforms. Specifically, since December of 2019, the month-over-month average daily traffic volume is up by 7% on social platforms and 10% on mobile entertainment platforms.
These are noteworthy numbers in any context, but they?re particularly remarkable given that these increases are coming in the wake of the holiday season when numbers are generally already higher than normal.
Other areas where we?re seeing uncharacteristic volume surges are on dating platforms and video streaming platforms.
All of these patterns are not necessarily surprising given the context?after all, if people are forced to stay home, it follows that they?re going to be increasingly active on platforms that allow them to connect virtually. What is surprising, however, is that fraud patterns are not necessarily following the same patterns. We are certainly seeing a great deal of new and emerging fraud threats during the current crisis, but things aren?t as simple as fraud going up or down as traffic volume goes up and down.
Fraud Rate Variability Within Single Verticals
In a previous post, we detailed how fraud patterns are, in fact, quite variable across online verticals. What we are additionally seeing is that fraud patterns are actually varying within a single vertical.
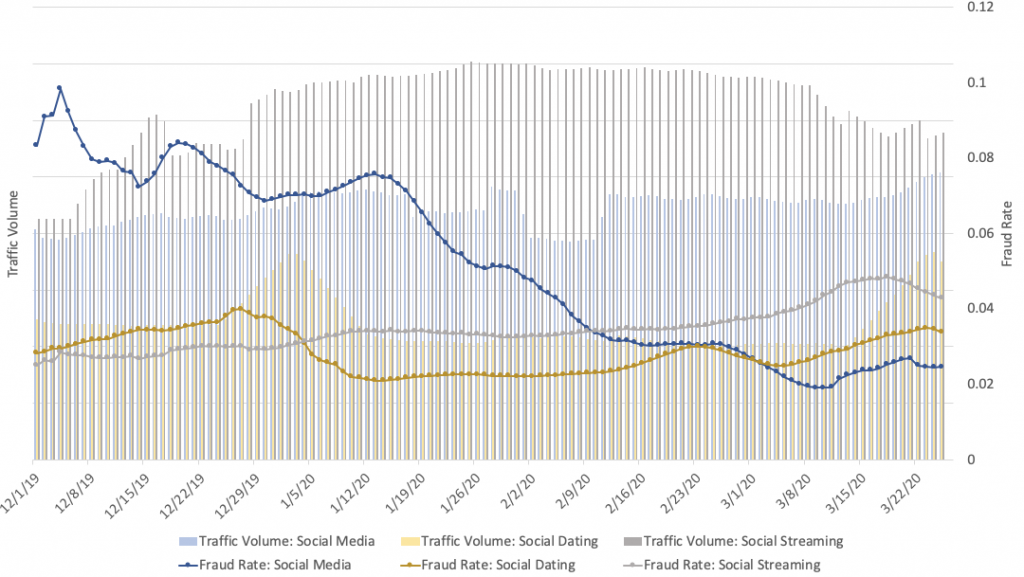
Unquestionably what is most striking about the figure above is the significant decline in fraud rates on social media. While these rates have remained relatively level on dating and video streaming sites through the holiday season?and throughout the COVID-19 crisis?fraud rates are down considerably on social media sites. Since January, the drop is nearly 70%.
Social Media Fraud vs. Email Phishing and Social Engineering Attacks
At face value, this may seem counterintuitive, as increases in traffic volume would seem likely to drive parallel increases in fraud activity. That this does not appear to be the case warrants investigation. While it is still far too early to make conclusive observations, we can consider some theories based on broader fraud trends emerging during the crisis.
The most likely explanation is that social engineering and phishing attacks conducted via email have proven to be lucrative early on, and as fraudsters go where the money is, they are simply concentrating their efforts elsewhere for the time being. Whether fraudsters return to social media for future attacks remains to be seen. The most important observation we can make here is that modern fraudsters are highly adaptive and that the only reliable constant is the reality of ongoing change.
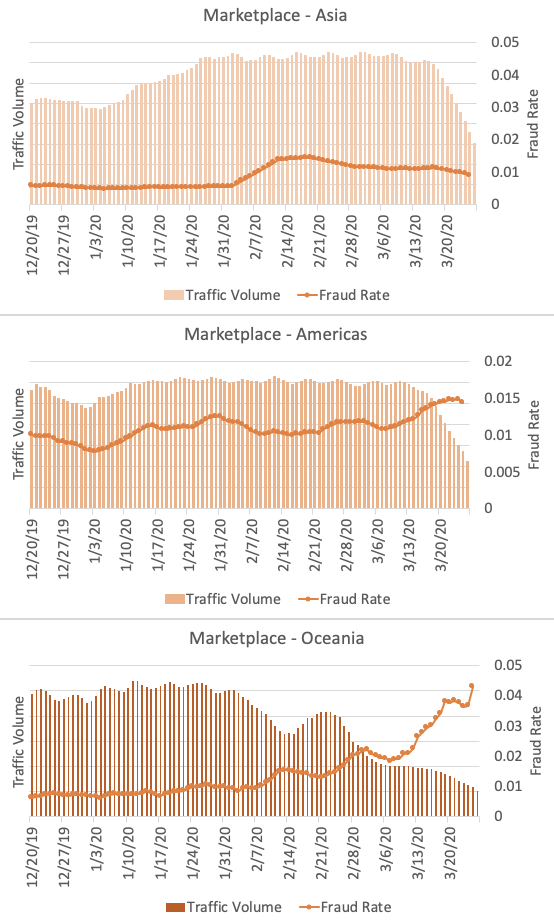
Marketplace Fraud and Geographic Dynamism
Another set of data points we can look at that reinforces our sense of fraudster adaptability has to do with the geographic movement of fraud rates. Specifically, we can look at fraud as it is impacting peer-to-peer marketplaces.
These platforms, which allow users to buy, sell, or swap items, have become increasingly popular in recent years. However, these sites also appear to be heavily impacted by the virus outbreak, as more people practice social distancing and avoid in-person contact. We see traffic volume on marketplace platforms decreasing in recent weeks, down 24% since mid-March. Simultaneously, we see fraud rates increasing, and it appears this trend varies across geographic regions.
The figures below show the traffic volume and fraud rate across Europe, Asia, the Americas, and Oceania (which includes Australia and New Zealand). The reduction in traffic volume appears to be the most significant in the Americas (-62% since mid-March), with Asia (-57%), Oceania (-47%), and Europe (-15%) not far behind.
Across all regions, the fraud rate had an uptick bump around early February and had stayed high since then. We can see that this corresponds to the fraud rate ?bump? first observed in Asia in early February, then (as it subsided somewhat in Asia) other regions began to experience increases in March, most notably in the Americas (+23%) and Oceania (+91%).
The Migration Online: Impacts, Threats, and Detection Challenges
As noted above, it?s still very early days when it comes to understanding COVID-19?s full impact and the new fraud threats that are emerging in its wake. One of the key singularities of this particular crisis is the massive global migration online, and this unprecedented scenario serves to complicate analysis in at least two key ways.
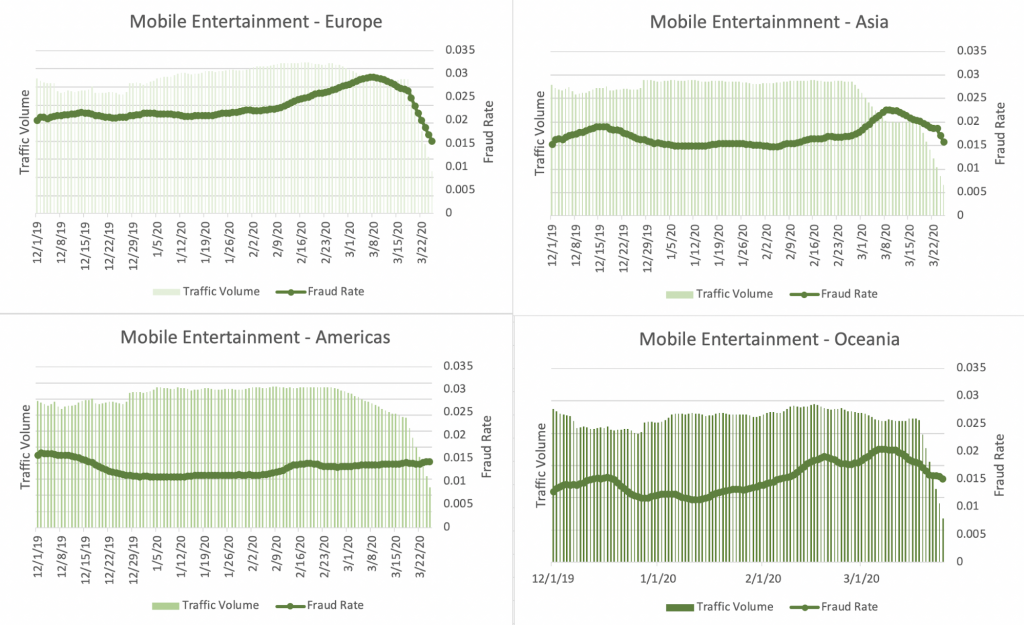
Fraud Rate Ratios on Mobile Entertainment Platforms
First is the fact that a significantly higher number of users online means ratios of good behavior vs. fraudulent behavior are going to look very different, in ways that can potentially be deceiving.
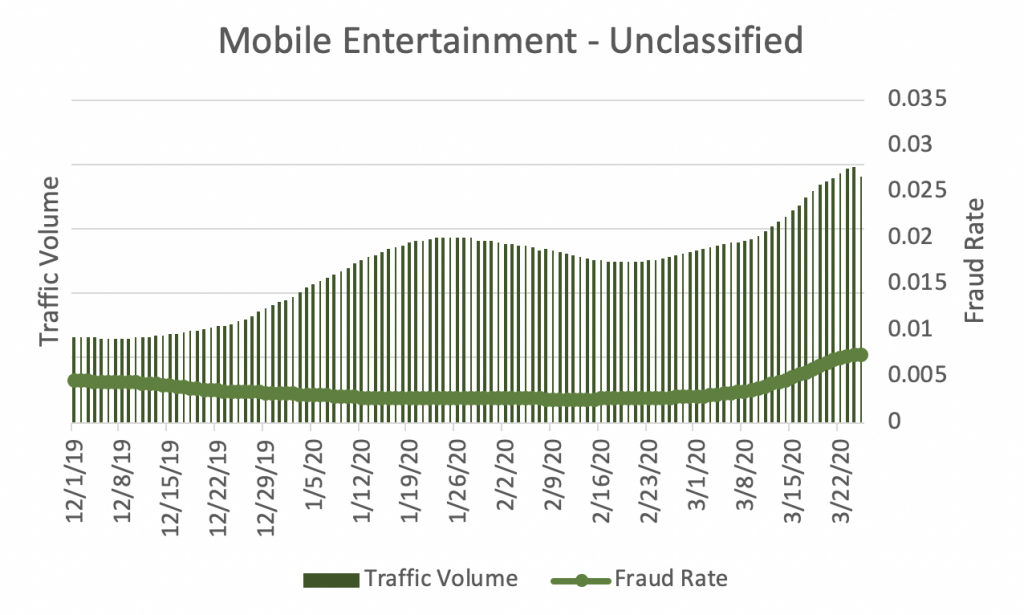
For example, for mobile entertainment platforms, the fraud rate has generally declined across most regions. In the last two weeks, the fraud rate is down 45% in Europe, 29% in Asia, and 24% in Oceania, though increasing around 4% in the Americas. At face value, we would take these numbers to mean that there is less fraud. However, it is equally likely that the rates are down only because so many more good users are turning to mobile entertainment while following shelter-in-place guidelines. In other words, fraud rates may be down, but fraud activity itself is staying steady.
When we delve further into fraud numbers as they pertain to mobile entertainment, we find that traffic volume also declined across multiple regions?for those regions where we could map the user?s network location (using IPv4 addresses). It appears that the geographic location is ?unclassified? for a large fraction of traffic we received on mobile platforms, mostly corresponding to IPv6 addresses. As this ?unclassified? traffic increases in volume as well as fraud rate, it calls for the importance of securely monitoring all channels. Fraudsters always take the path of least resistance, shifting to new vulnerabilities or easier points-of-entry for conducting attacks.
Distinguishing Fraud from Normal Behavior During Periods of Increasing Behavioral Changes
A second complicating factor is that we have a multitude of online behavioral changes happening at the same time, such that there is more noise mixed in when trying to differentiate fraudulent from legitimate activity. Almost all of us are experiencing changes to our lifestyles as a result of the global virus outbreak, and this is upending the detection paradigm. In normal times, for example, what might register as a suspicious behavioral shift could, in fact, be ?normal? in the context of the crisis.
At the same time, fraudulent activities that might normally be quickly exposed could instead ?blend in with the crowd? and appear benign. It?s essential that organizations are able to employ contextual detection strategies to better understand user behavior during situations like these when large-scale behavioral shifts are the norm.
One of the more obvious changes is how we move around our physical and virtual spaces. Adhering to social distancing and shelter-in-place policies means our network-level movements are more restricted. While we (through our devices) previously changed network IP addresses as we roamed through physical spaces in our daily lives (e.g., commuting to work, meeting up with friends, going to the park), this is no longer the case.
Complementary to reports of human mobility based on GPS tracking (e.g., from Unacast, New York Times, and Google), here is a different view of the effects of shelter-in-place based on users? network mobility ? in terms of IP subnet ?switches.? The chart below shows the percentage change in users that switch between multiple IP subnets after the COVID-19 outbreak (specifically, comparing the beginning of February to the end of March 2020).
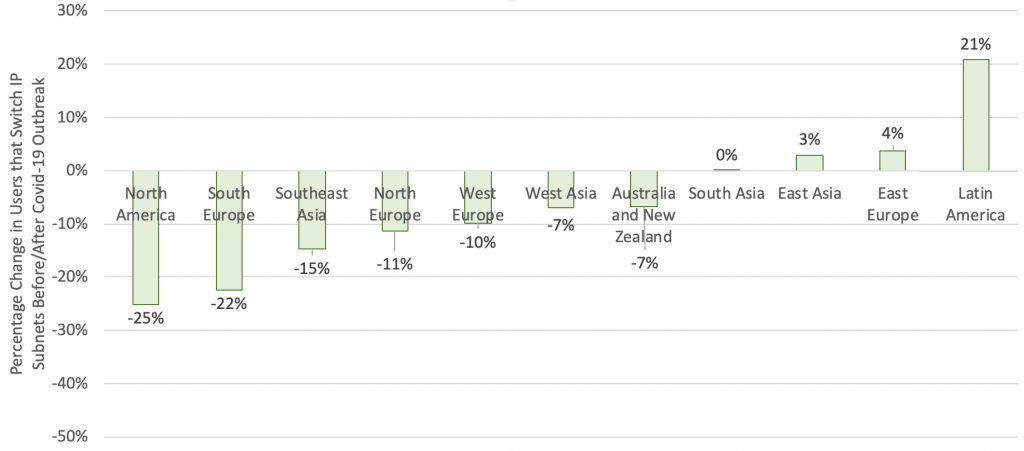
Across the board, users in most regions have drastically reduced their network mobility?presumably their physical travels, as well. For example, there are 25% fewer users in North America that switched between different networks, compared to two months ago.
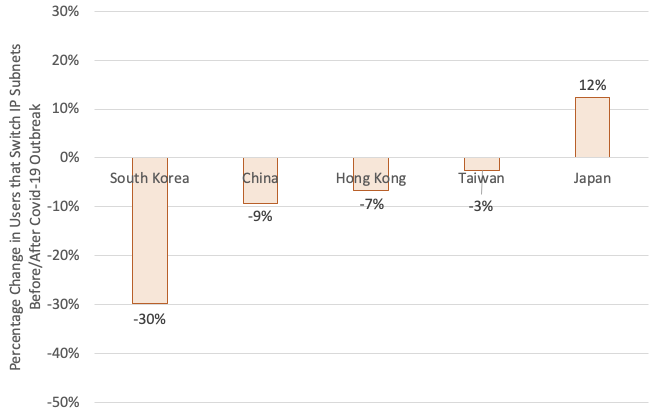
In East Asia, where swift actions to contain the virus were taken, the reduction is even more significant, e.g., in South Korea (-30%), China (-9%), Hong Kong (-7%), and Taiwan (-3%). Japan appears to be an outlier, perhaps due to the absence of a government-mandated lockdown.
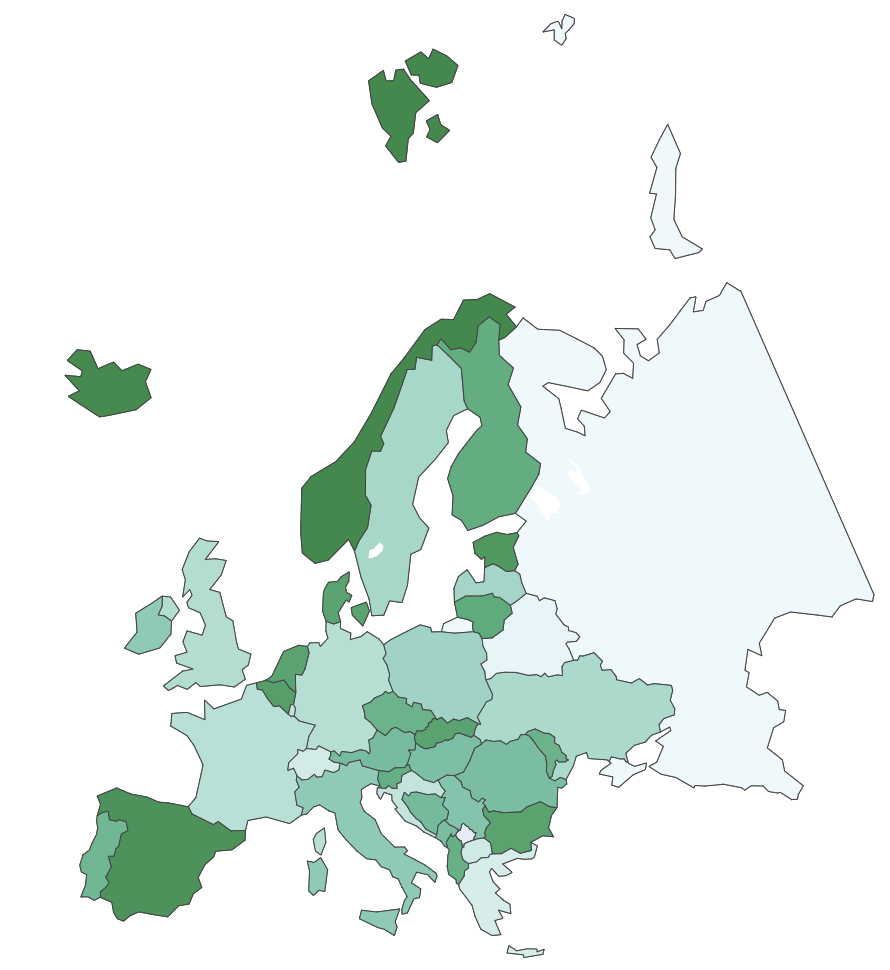
The same trend can be observed in much of Europe, with an average percentage decline of 17% by country.
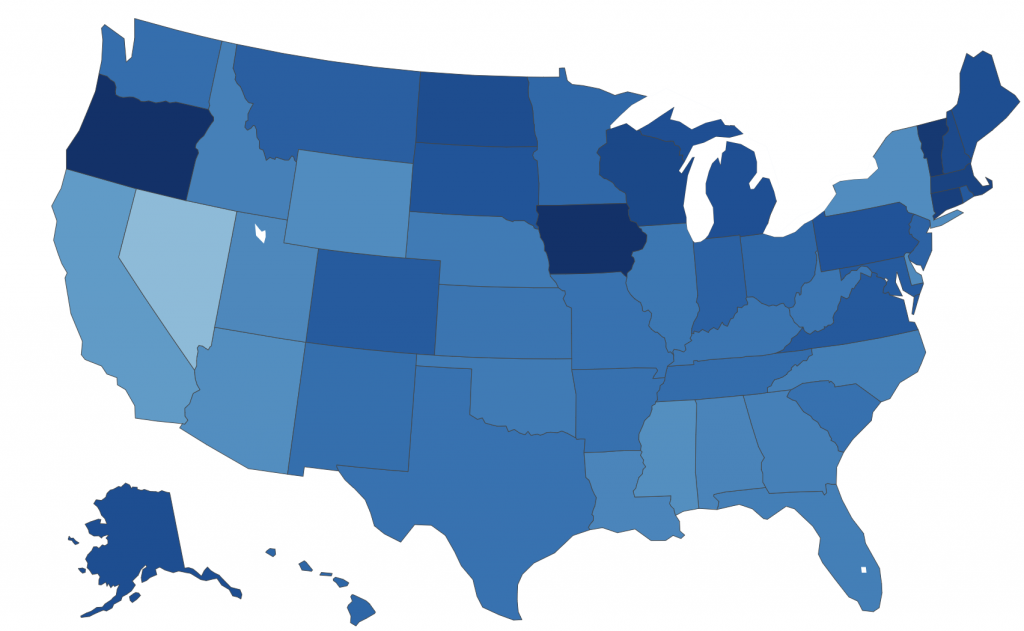
Across the U.S. states, the average percentage decline is 42%. In terms of their network activities, U.S. users appear to be much less mobile in the last two months compared to other countries.
While we can take the above as positive evidence that people are indeed embracing shelter-in-place and social distancing practices, these new realities can make it comparatively more difficult to expose fraud. We?ve only touched on network-level activities here, and only on the surface, but changes to other online behaviors ?driven by lifestyle change and demand, and manifested in an influx of registrations, orders, promotions, applications, or chatter on online platforms? further complicates the problem.
Conclusion
As we continue to amass and analyze data during this crisis, the one inescapable takeaway is that the highest levels of vigilance must be maintained if we?re to ensure security and safety for businesses, their data, and their customers. As situations continue to evolve, fraudsters continue to adapt. Given the many mitigating factors making fraud detection even more challenging than usual, it?s essential that businesses are equipped with advanced solutions that enable holistic analysis in real time. The virus isn?t the only fast-moving thing we need to stay ahead of?fraud threats are moving equally fast.
Source: datavisor.com